Bike Sales Analysis Dashboard
Sep 4, 2023
Project Title: Bike Sales Analysis Dashboard
Tools: Microsoft Excel
GitHub repository link: The repository link for the code and files - Link
Approach:
Thoroughly comprehended the provided dataset.
Conducted data cleaning to remove duplicates, spaces, special characters, and performed formatting.
Introduced custom 'Age Brackets' columns for additional insights.
Created Pivot tables, charts, and graphs for comprehensive data summarization.
Developed an interactive Excel dashboard with slicers for user-friendly data exploration.
Key Results:
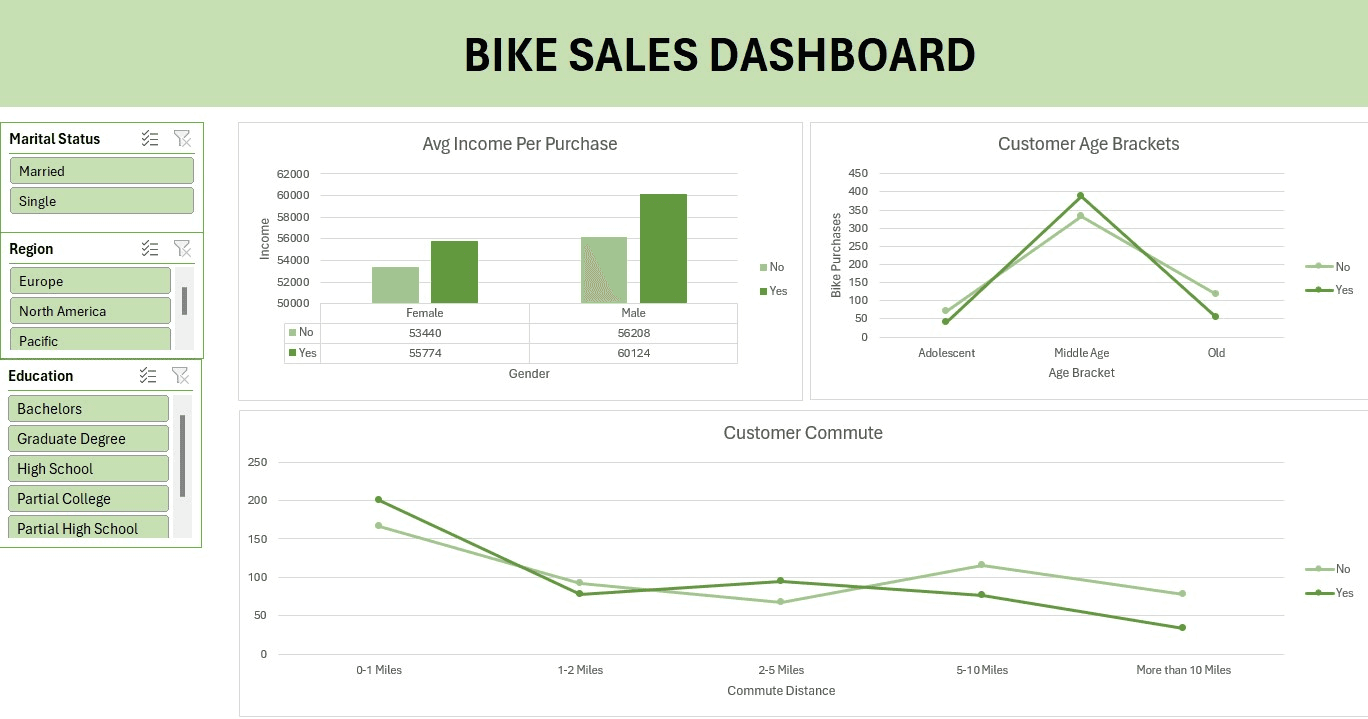
Gender and Income: Males, with an average income of $60,124, displayed higher bike purchase rates compared to females, who had 7% lower average income.
Age-Related Purchases: Customers in the middle age group (31-54 years) purchased four times more bikes than Adolescent and Old age groups.
Commute Distance: Short commutes (0-1 miles) were more common reasons for bike purchases than longer commutes (More than 10 Miles).
Visualizations: Utilized Pivot tables, charts, and graphs to visually represent data and enhance understanding.
Conclusion: This project leveraged Microsoft Excel to provide valuable insights into bike sales trends, highlighting key factors influencing consumer choices. The interactive dashboard allows users to explore the data dynamically, enhancing their understanding of bike sales dynamics.